Here is an error I got when using an image generation deep learning model. It is a common error Engineers get when using PyTorch on GPU. To solve this error, a deep dive into PyTorch’s GPU Memory management is needed. So fasten your seat belts 🙂
torch.OutOfMemoryError: CUDA out of memory. Tried to allocate 58.00 MiB. GPU 0 has a total capacity of 3.71 GiB of which 57.00 MiB is free. Including non-PyTorch memory, this process has 3.64 GiB memory in use. Of the allocated memory 3.51 GiB is allocated by PyTorch, and 74.06 MiB is reserved by PyTorch but unallocated. If reserved but unallocated memory is large try setting PYTORCH_CUDA_ALLOC_CONF=expandable_segments:True to avoid fragmentation. See documentation for Memory Management (https://pytorch.org/docs/stable/notes/cuda.html#environment-variables)
This error message provides valuable insights:
- Memory Exhaustion: The GPU’s available memory (3.71 GiB) has been depleted.
- Allocation Attempt: PyTorch attempted to allocate 20.00 MiB, but there wasn’t enough free space.
- Memory Usage: 3.68 GiB is in use, with 3.61 GiB allocated by PyTorch and 5.27 MiB reserved but unallocated.
- Fragmentation Hint: The message suggests that memory fragmentation might be contributing to the issue, and setting
PYTORCH_CUDA_ALLOC_CONF=expandable_segments:Truemight help.
PyTorch’s Memory Management Strategies
PyTorch employs a sophisticated memory management system to optimize GPU resource utilization. Here’s a detailed breakdown:
- Caching Allocator: PyTorch uses a caching allocator to reduce the overhead of frequent memory allocations and deallocations. This improves performance but can also contribute to memory fragmentation if not managed effectively.
- Memory Pooling: PyTorch pools memory into larger blocks to reduce fragmentation and improve allocation efficiency.
- Automatic Deallocation: PyTorch automatically deallocates memory for tensors that are no longer needed, reducing the risk of memory leaks.
torch.cuda.empty_cache(): This function manually clears the cached memory, potentially freeing up unused resources.PYTORCH_CUDA_ALLOC_CONF: This environment variable allows you to fine-tune memory allocation behavior. Experimenting with different configurations can help address fragmentation issues.
Profiling Tools for Deep Insights
To gain a granular understanding of memory usage and identify bottlenecks, profiling tools are indispensable:
NVIDIA System Management Interface (NVIDIA-smi):
- Real-time monitoring of GPU utilization, temperature, and memory usage.
- Provides detailed information about processes and applications consuming GPU resources.
- Example usage in Bash:
nvidia-smi
watch -n0.1 nvidia-smi
PyTorch Memory Profiler
- Records memory allocations and deallocations during program execution.
- Visualizes memory usage patterns over time.
 enable memory history, which will
# add tracebacks and event history to snapshots
torch.cuda.memory._record_memory_history()

run_your_code()
torch.cuda.memory._dump_snapshot("my_snapshot.pickle")
Open pytorch.org/memory_viz and drag/drop the pickled snapshot file into the visualizer. The visualizer is a javascript application that runs locally on your computer. It does not upload any snapshot data.
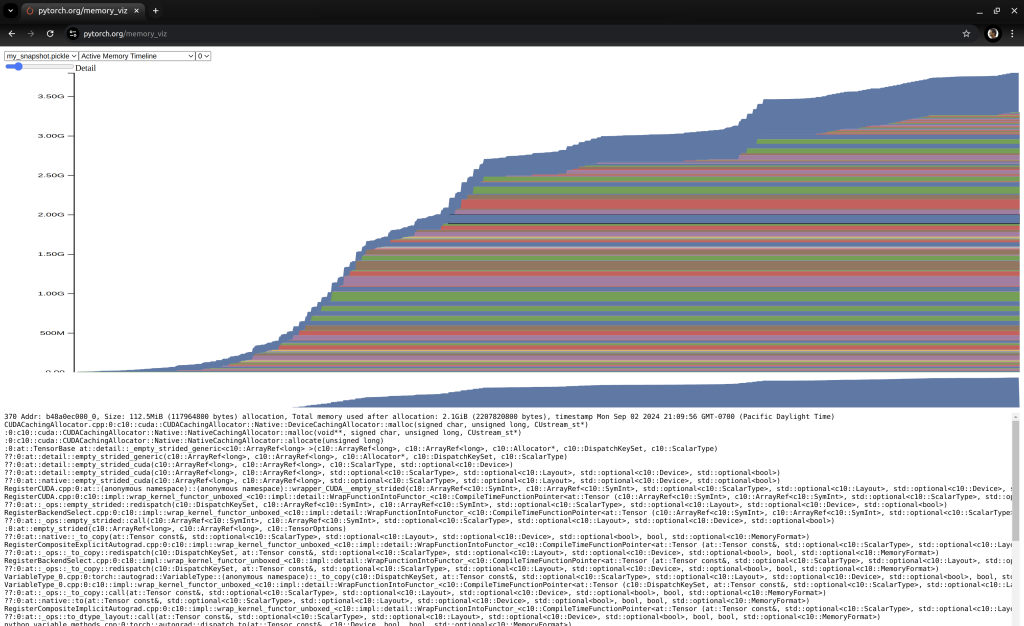
Active Memory Timeline in PyTorch Memory visualizer
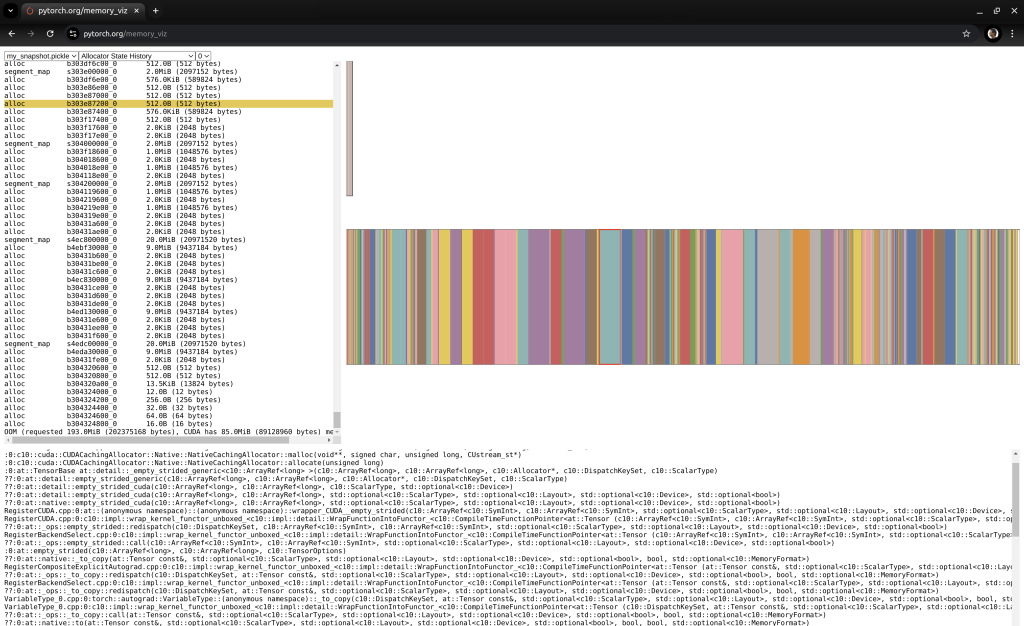
Allocator State History in PyTorch Memory visualizer
- Integrates seamlessly with PyTorch models and training scripts.
- Example usage:
import torch.profiler as profiler
with profiler.profile() as prof:
#Your PyTorch code here
# ...# Print the profiling results print(prof.key_metrics())
Nsight Systems:
- A powerful profiling tool that provides detailed insights into GPU utilization, memory usage, and performance bottlenecks.
- Offers visualizations for performance analysis.
- Example usage in Bash
nsight-systems --profile-gpu --launch-command="python your_script.py"
Debugging and Optimization Strategies
- Reduce Model Size: If possible, use a smaller or optimized version of the Stable Diffusion model to reduce memory requirements.
- Adjust Batch Size: Experiment with different batch sizes to find the optimal balance between performance and memory usage.
- Optimize Data Loading: Ensure your data loading pipeline is efficient and avoids unnecessary memory copies.
- Monitor Memory Usage: Use profiling tools to track memory consumption and identify areas for optimization.
- Consider Memory-Efficient Techniques: Explore techniques like gradient checkpointing or quantization to reduce memory usage.
- Leverage Cloud-Based GPUs: If your local hardware is constrained, consider using cloud-based GPU instances with larger memory capacities.
Additional Considerations:
- GPU Driver Updates: Ensure you have the latest GPU drivers installed to avoid performance issues or memory leaks.
- Operating System Configuration: Check your operating system’s memory management settings to see if they can be optimized for better GPU performance.
- TensorFlow vs. PyTorch: If you’re using TensorFlow, explore its memory management features and best practices.
Advanced Memory Optimization Techniques
For more advanced scenarios, consider the following techniques:
- Memory Pooling: Manually create memory pools to allocate and reuse memory blocks efficiently. This can be helpful for specific use cases where memory allocation is frequent.
- Custom Memory Allocators: If you have deep knowledge of CUDA and memory management, you can create custom memory allocators to address specific memory usage patterns.
- Profiling and Benchmarking: Use profiling tools to identify performance bottlenecks and benchmark different memory optimization strategies to measure their effectiveness.
Beyond the Code: A Deeper Dive into Memory Management
While we’ve covered the essential aspects of PyTorch’s memory management, it’s worth exploring the underlying mechanisms in more detail.
- CUDA Memory Allocator: CUDA, the underlying framework for NVIDIA GPUs, provides its own memory allocator. PyTorch interacts with this allocator to allocate and manage memory on the device.
- Memory Fragmentation: When memory is allocated and deallocated frequently, it can lead to fragmentation, where small, unused memory blocks are scattered throughout the memory space. This can make it difficult for PyTorch to allocate larger contiguous blocks of memory.
- Memory Pooling: PyTorch’s memory pooling strategy involves creating larger memory pools and allocating memory from these pools. This can help reduce fragmentation and improve memory allocation efficiency.
- Automatic Deallocation: PyTorch uses reference counting to track memory usage and automatically deallocates memory for tensors that are no longer needed. However, it’s important to be aware of potential memory leaks if tensors are not properly managed.
- Profiling Tools: Profiling tools like Nsight Systems can provide detailed insights into memory usage patterns, including memory allocations, deallocations, and access patterns. This information can be invaluable for identifying memory-related bottlenecks and optimizing your code.
Conclusion
Overcoming the “CUDA out of memory” error requires a deep understanding of PyTorch’s memory management strategies and the ability to leverage profiling tools effectively. By following the techniques outlined in this blog post, you can optimize your PyTorch applications for efficient GPU memory usage and unlock the full potential of your NVIDIA GPU