Deep Dive into GPU Compute Hierarchy

Modern NVIDIA GPUs are feats of hierarchical design, optimized to maximize parallelism, minimize latency, and deliver staggering computational throughput. Building upon Part 1, which introduced the high-level architecture of NVIDIA GPUs, this is Part2 – a Deep dive into GPU Compute Hierarchy: Graphics Processing Clusters (GPCs), Texture Processing Clusters (TPCs), Streaming Multiprocessors (SMs), and CUDA cores. Understanding this hierarchy is essential for anyone looking to write optimized CUDA code or analyze GPU-level performance.


1. Graphics Processing Clusters (GPCs)

1.1 Overview

At the top of NVIDIA’s compute hierarchy lies the Graphics Processing Cluster. A GPC is an independently operating unit within the GPU, responsible for distributing workloads efficiently across its internal resources. Each GPC contains a set of Texture Processing Clusters (TPCs), Raster Engines, and shared control logic.

📊 GPC Block Diagram:
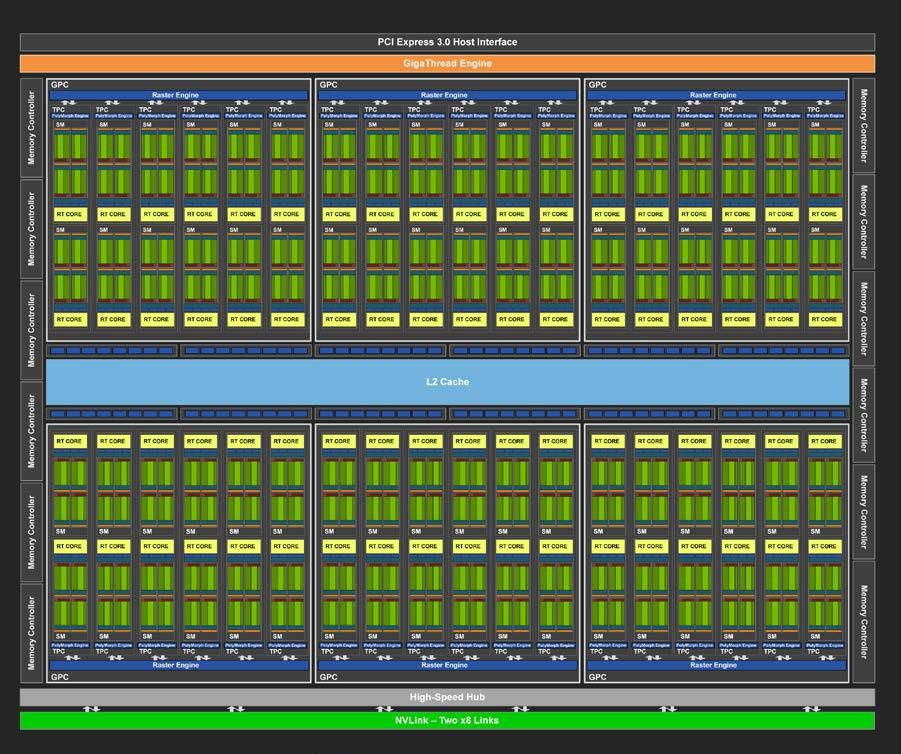
Nvidia Turing TU102 Full GPU with 72 SM Units.
Nvidia Turing TU102 Full GPU with 72 SM Units. Image : developer.nvidia.com
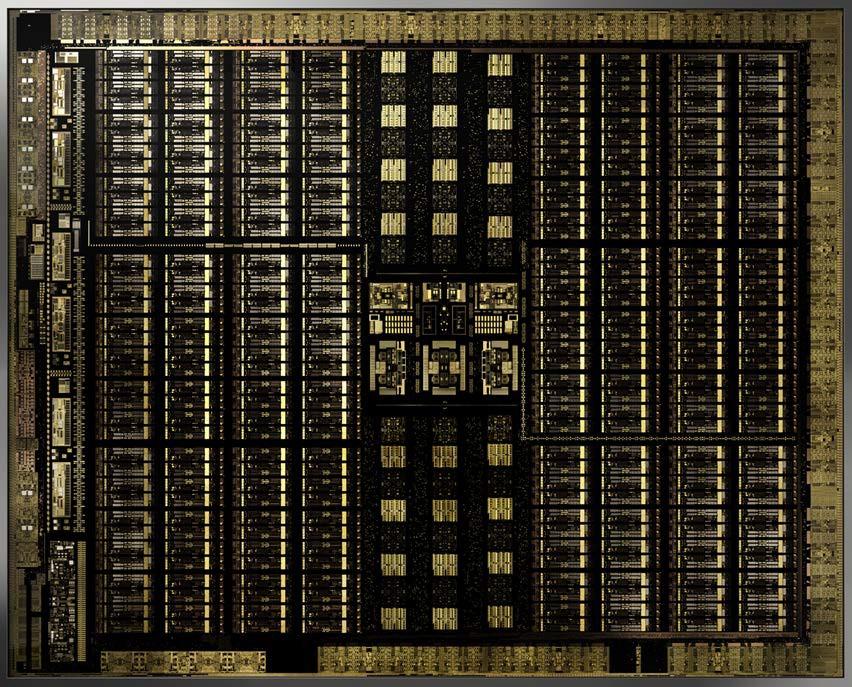
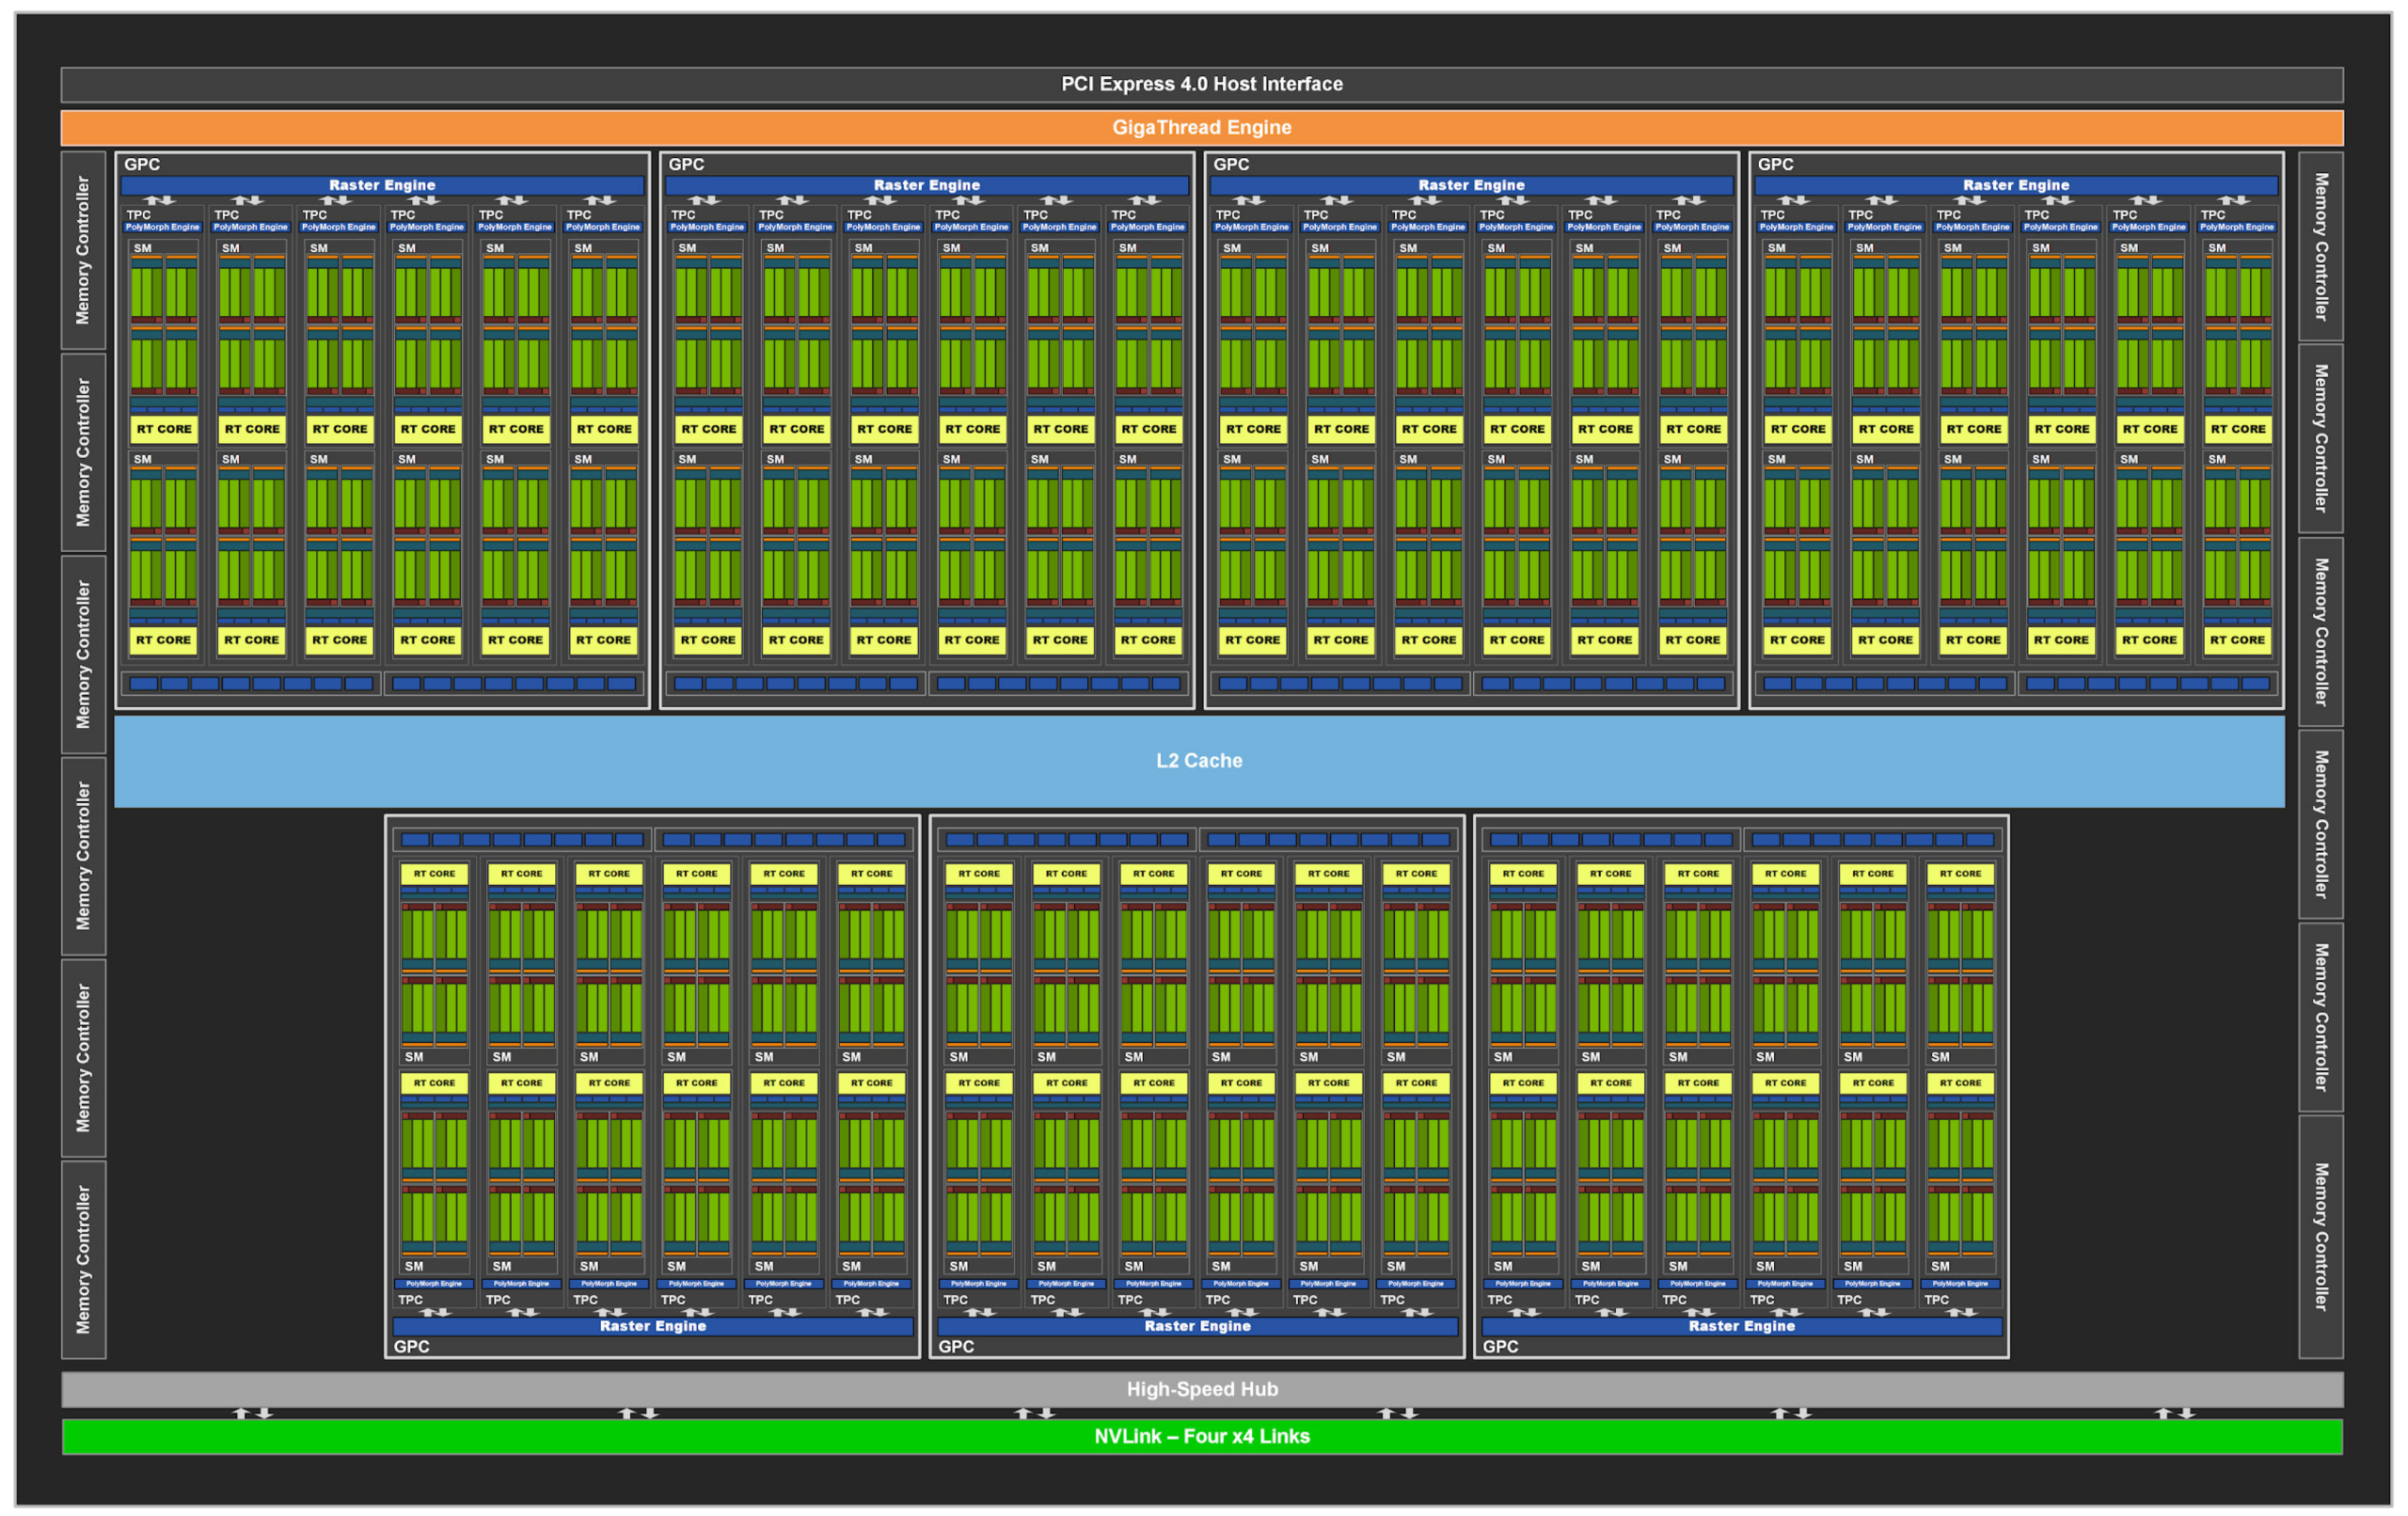
Internal Die layout of Nvida Turing TU102 GPU .
Internal Die layout of Nvida Turing TU102 GPU . Image : developer.nvidia.com

1.2 GPC Architecture

Each GPC includes:

  • One or more Raster Engines
  • Several TPCs (typically 2 to 8 depending on the GPU tier)
  • A Geometry Engine (in graphics workloads)

📘 Example GPC layout in RTX 30 series:
Nvidia RTX30 GPC block Diagram
Nvidia RTX30 GPC block Diagram. Image: Nvidia Ampere GA102 GPU Architecture document

1.3 Scalability Role

More GPCs generally equate to more parallel compute and graphics capability. High-end GPUs like the H100 feature many GPCs to support large-scale AI workloads, while mobile GPUs may only include one or two.


2. Texture Processing Clusters (TPCs)

2.1 Role of TPCs

TPCs are the next level down. A TPC groups together Streaming Multiprocessors (SMs) and a set of fixed-function texture units, providing both compute and graphics acceleration. Originally optimized for texture mapping and rasterization, TPCs in modern GPUs support general-purpose compute as well.

2.2 Components of a TPC

Each TPC typically contains:

  • Two Streaming Multiprocessors (SMs)
  • Shared L1 cache
  • Texture units (for graphics and compute shaders)
  • A PolyMorph Engine (responsible for vertex attribute setup and tessellation)

📊 TPC Diagram with SMs and Texture Units:
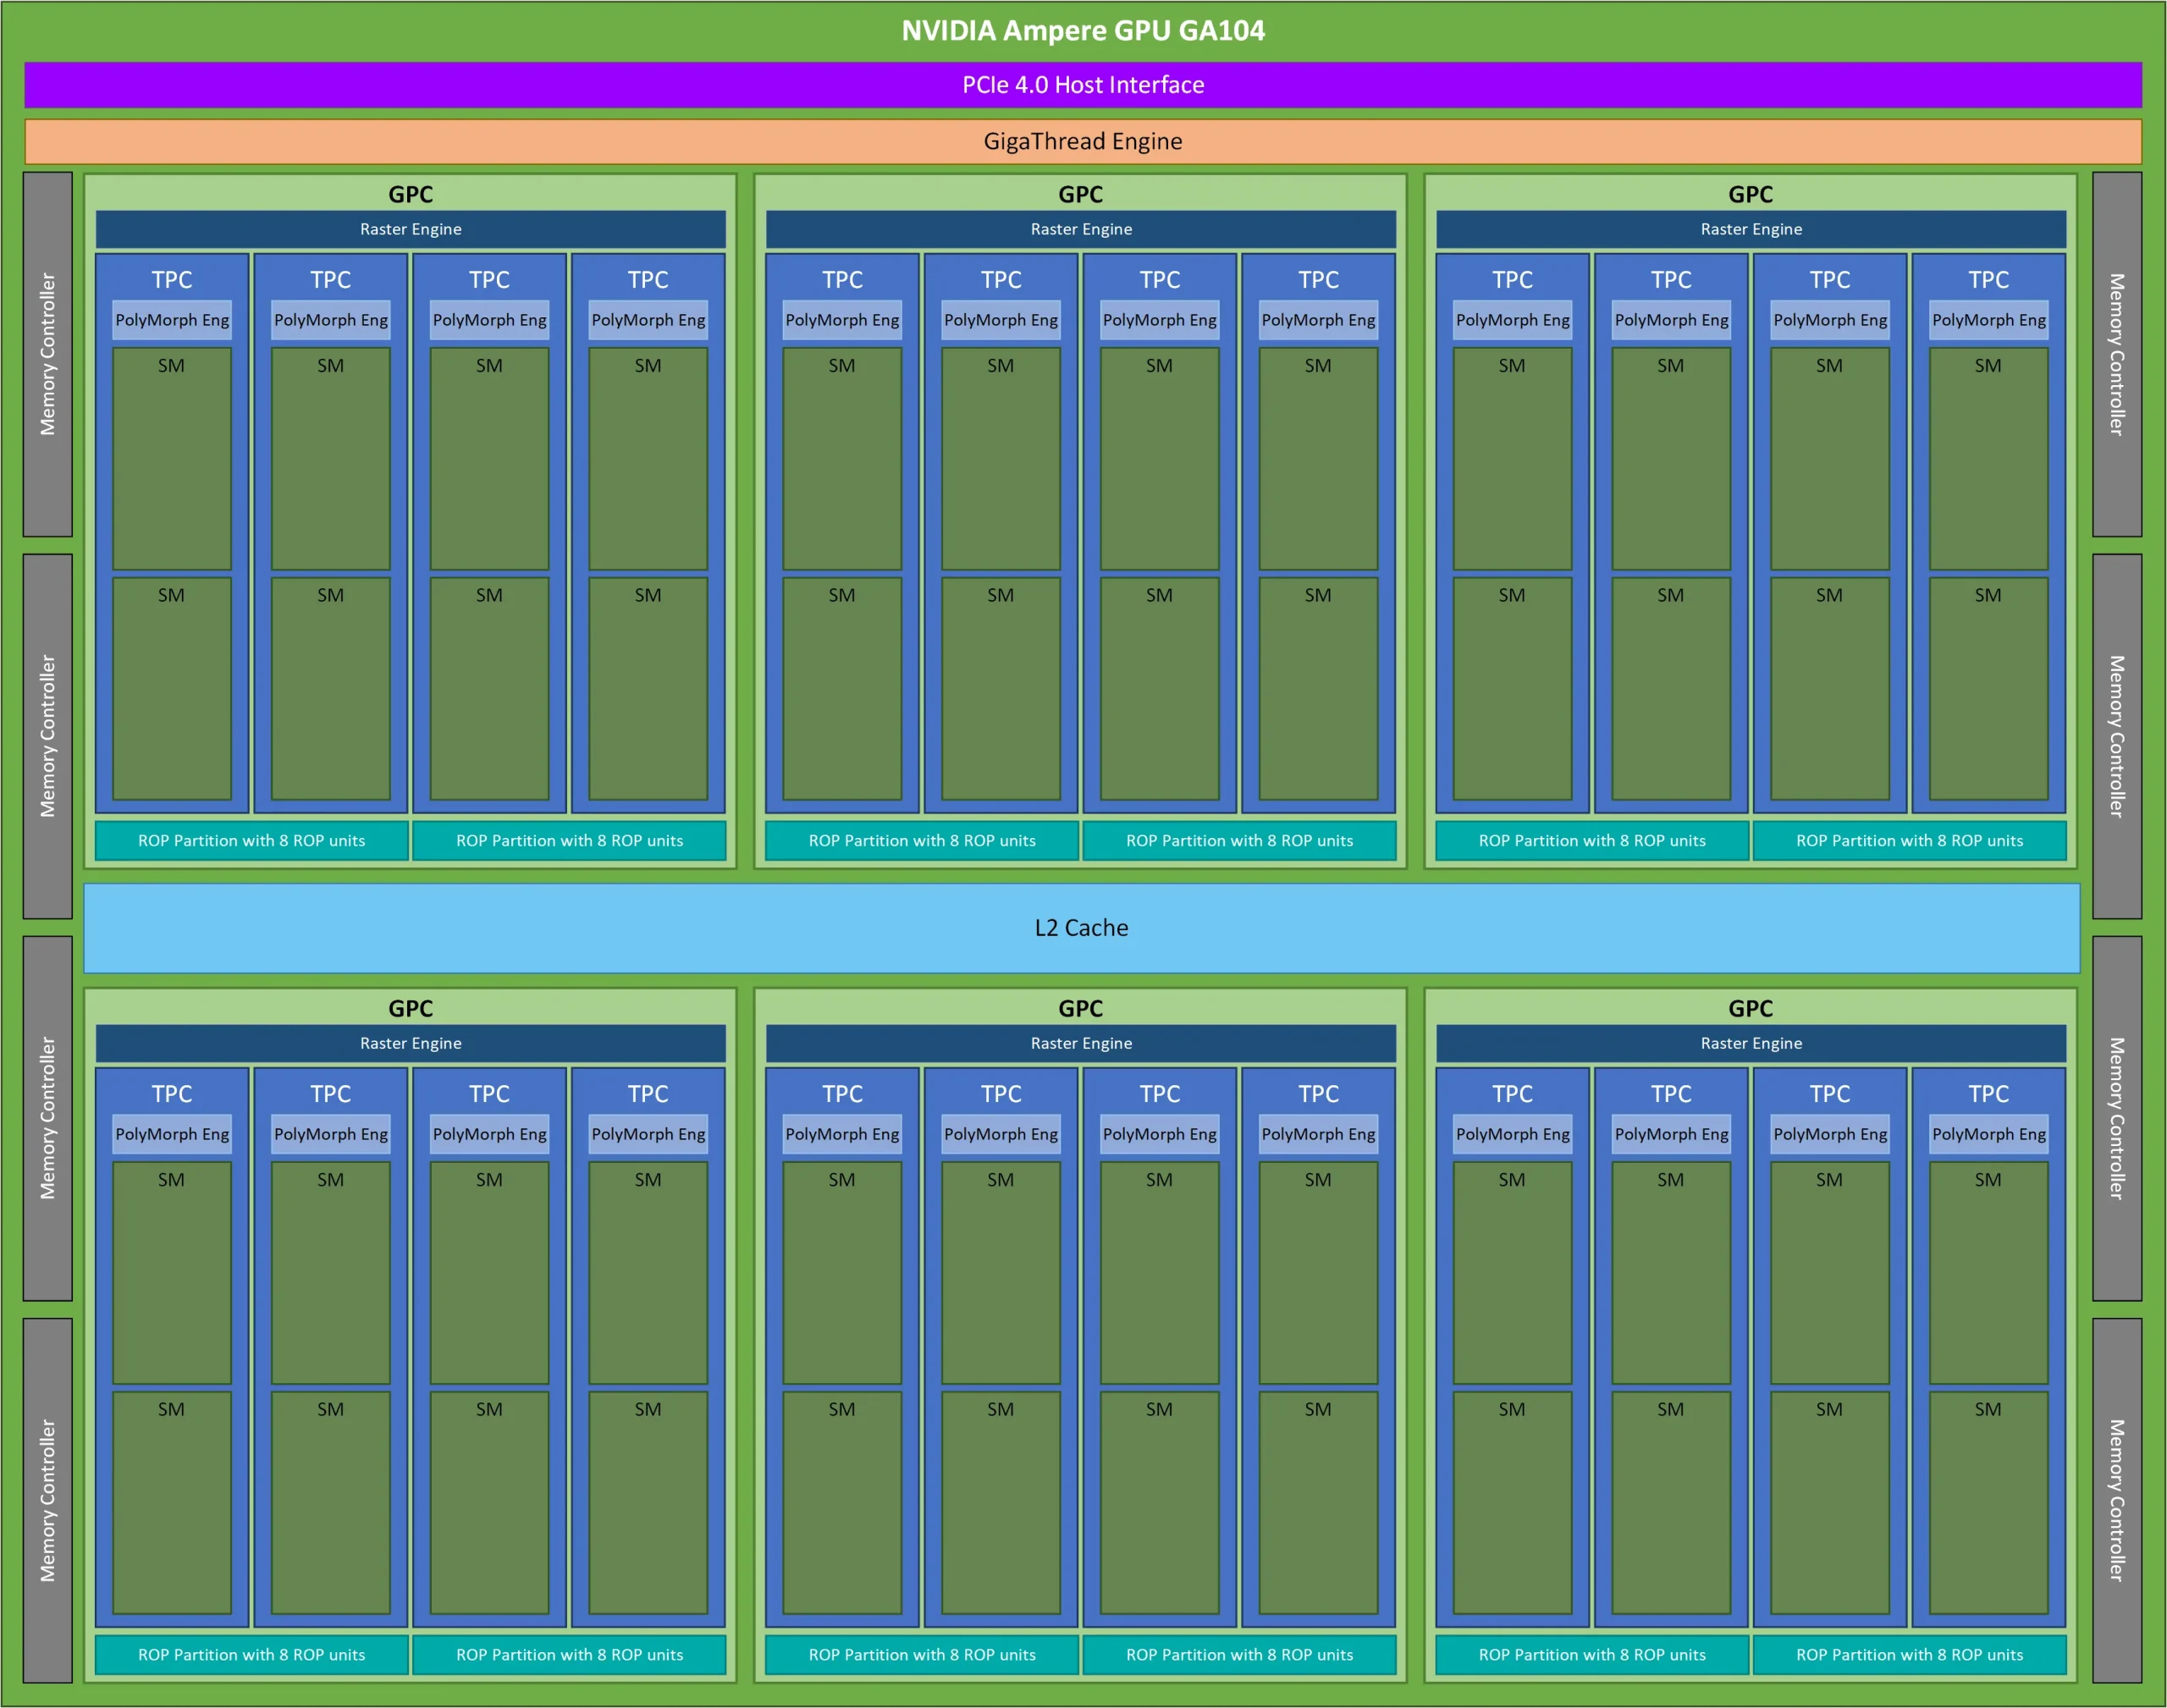
NVIDIA Ampere GA104 architecture showing GPC, TPC, SM.
NVIDIA Ampere GA104 architecture showing GPC, TPC, SM. Image: wolfadvancedtechnology.com

2.3 Texture Mapping

Texture units in the TPC fetch texels from memory, perform filtering (e.g., bilinear, trilinear), and handle texture addressing. These units have been extended to support texture sampling for compute workloads, such as in scientific visualization.


3. Streaming Multiprocessors (SMs)

3.1 Importance of SMs

Streaming Multiprocessors are the core programmable units of NVIDIA GPUs. They execute the majority of instructions, including floating-point arithmetic, integer operations, load/store instructions, and branch logic.

3.2 SM Internal Structure

A modern SM (e.g., in the Hopper H100 or Blackwell B100) consists of:

  • Multiple CUDA cores (up to 128 per SM)
  • Load/Store Units (LSUs)
  • Integer and Floating Point ALUs
  • Tensor Cores (for matrix operations)
  • Special Function Units (SFUs)
  • Warp schedulers and dispatch units
  • Register files
  • Shared memory and L1 cache

📘 SM Layout Reference (Volta/Hopper SMs):
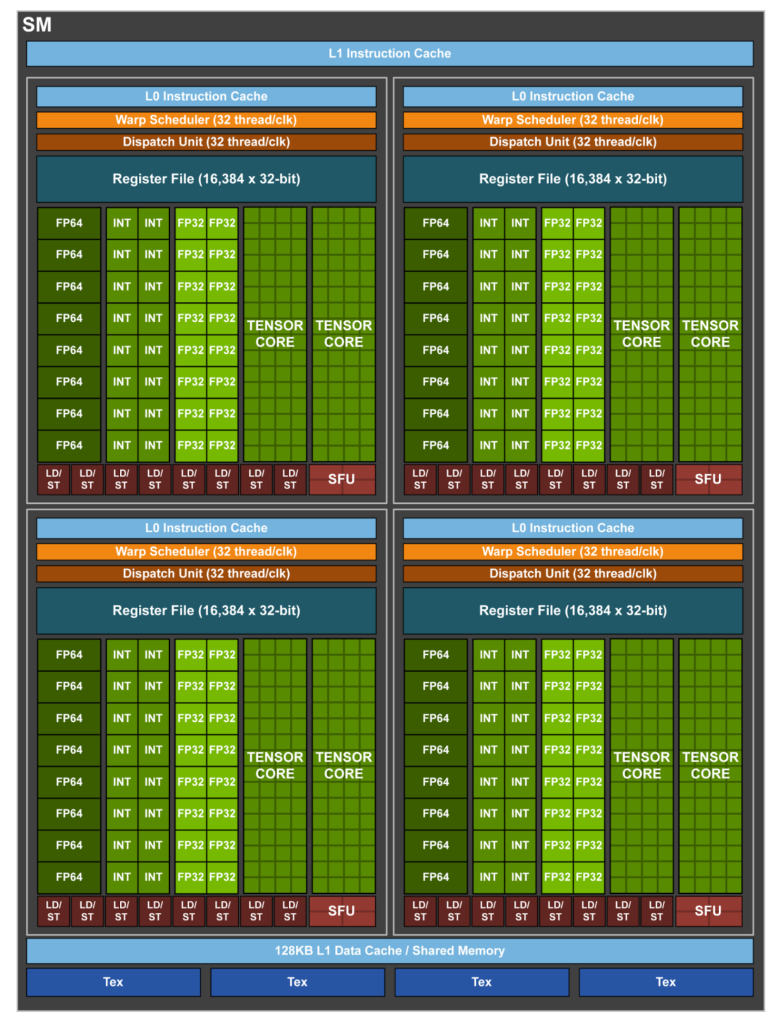
Nvidia Volta Streaming Multiprovessor (SM) block diagram
Nvidia Volta Streaming Multiprovessor (SM) block diagram. Image: Nvidia Volta Architecture Document

3.3 Warp Scheduling

The warp scheduler picks a ready warp from a warp pool and issues an instruction every clock cycle. Techniques like GTO (Greedy Then Oldest), Round-Robin, or Two-Level scheduling are used.

Key Benefits:

  • Latency hiding: Warps can be swapped out when memory access stalls occur.
  • Concurrency: Independent warps can issue instructions simultaneously.
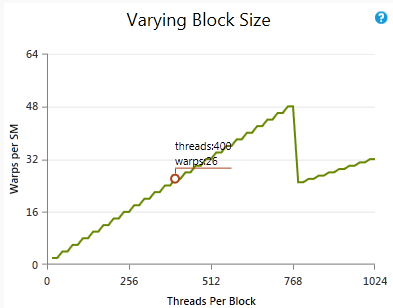
How varying the block size while holding other parameters constant would affect the theoretical Warp occupancy.
How varying the block size while holding other parameters constant would affect the theoretical Warp occupancy. Image: docs.nvidia.com

4. CUDA Cores

4.1 Role of CUDA Cores

CUDA cores, also called SPs (Streaming Processors), are the smallest execution units. Each core executes a single thread from a warp, performing basic arithmetic and logic operations.

4.2 Arithmetic Logic Units (ALUs)

Each CUDA core consists of:

  • FP32 FPU (Floating Point Unit)
  • INT ALU (Integer Arithmetic Unit)
  • Optional support for FP64, depending on SM design

4.3 SIMD Execution under SIMT Model

NVIDIA employs a SIMT (Single Instruction, Multiple Thread) model. Each warp executes one instruction at a time across 32 CUDA cores. Despite the SIMT term, the execution model is close to SIMD, with divergence managed by disabling inactive lanes.

4.4 Register Files and Local Storage

Each thread gets a set of registers from the SM’s register file. Efficient register usage is critical to avoiding spills to slower local memory.


5. Specialized Units within SMs

5.1 Tensor Cores

Tensor cores are designed to accelerate matrix multiplications—key in deep learning. They support:

  • FP16, TF32, INT8, and FP4 (in Blackwell)
  • Mixed-precision compute
  • Fused Multiply-Add (FMA) operations on tiles of 4×4, 8×8 matrices

5.2 Special Function Units (SFUs)

SFUs compute transcendental functions like sine, cosine, exp, log, and square root. These are not time-critical in AI workloads but crucial in graphics.

5.3 Load/Store Units (LSUs)

LSUs manage memory operations between registers, shared memory, and L1/L2 caches. Optimizing memory throughput requires understanding how LSUs queue and coalesce memory transactions.


6. Summary and Practical Takeaways

Understanding the hierarchical breakdown of GPC → TPC → SM → CUDA core helps:

  • Optimize kernel launch configurations
  • Maximize warp occupancy
  • Minimize divergence and memory stalls
  • Align workloads with hardware capabilities

In the next part of the series, we’ll explore Tensor Cores and RT Cores in-depth—covering how NVIDIA has fused graphics and AI acceleration into a unified pipeline.

✅ Introduction to NVIDIA GPU Architecture: Hierarchy, Cores, and Parallelism

👋 Welcome to GPU Architecture 101

In this first post in five-part series, where I introduce you to the NVIDIA GPU architecture—a foundation for parallel computing used in gaming, scientific computing, artificial intelligence, and more.

This guide is designed for engineering students and beginner developers who want to understand how modern GPUs work—from their evolution to core architectural blocks like GPCs, TPCs, SMs, and CUDA Cores.


🧠 What is a GPU and Why Does It Matter?

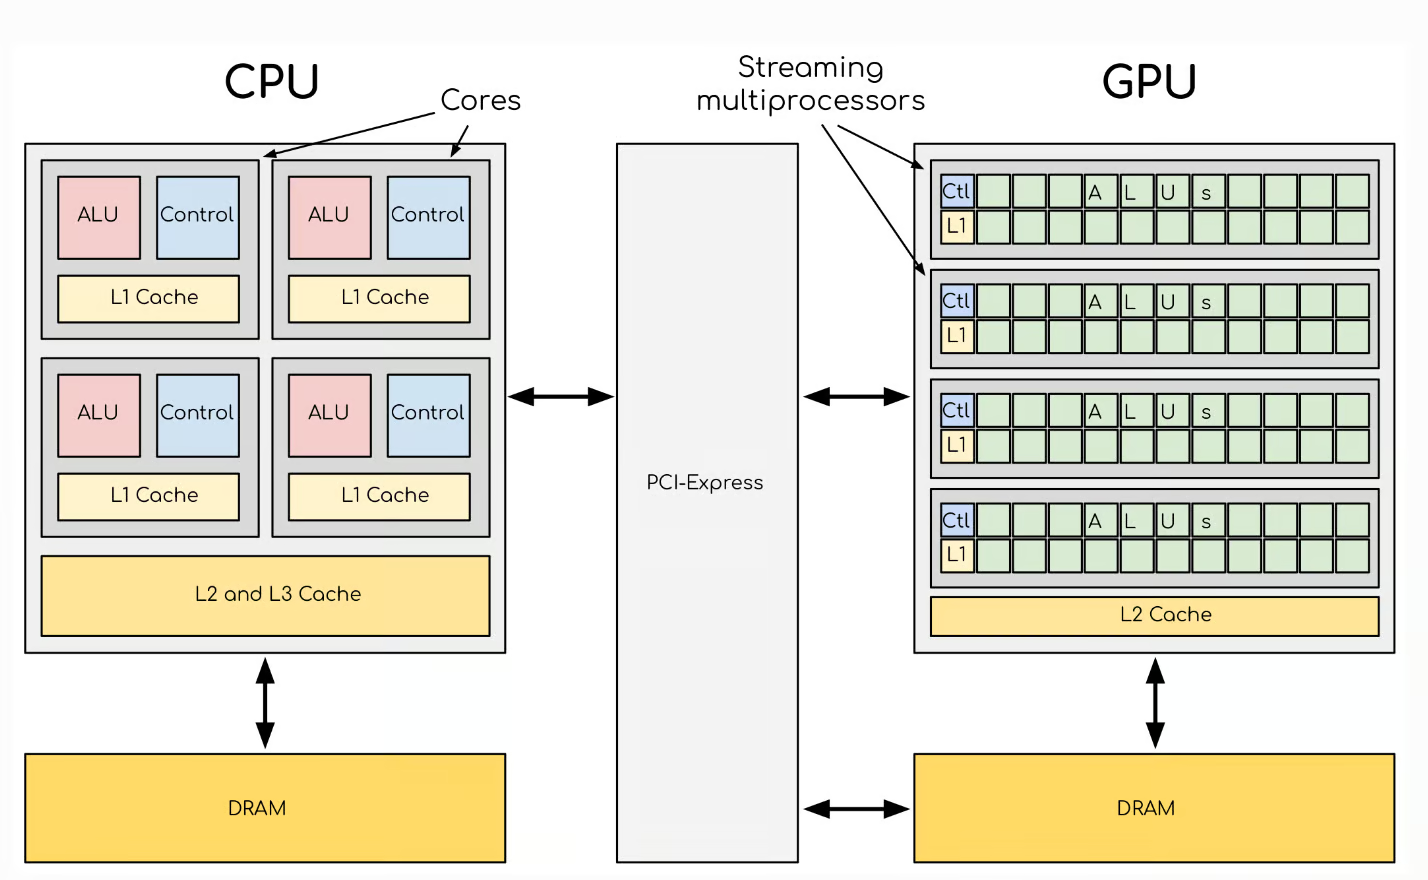
A GPU (Graphics Processing Unit) is a processor specialized in performing many operations simultaneously. Unlike CPUs, which handle one or a few tasks at a time, GPUs contain thousands of smaller cores to process data in parallel.

A Quick Comparison: GPU vs CPU

Source: Datacamp.com
FeatureCPUGPU
FocusSerial processingParallel processing
Cores4–32 large cores100s–1000s of smaller cores
UsageOS, logic, light appsGraphics, AI, simulations

📊 GPUs are ideal for matrix multiplications, image processing, 3D rendering, and training AI models.


🚀 NVIDIA GPU Architecture Hierarchy

Understanding the hierarchy inside a GPU is key to mastering performance tuning and CUDA programming.

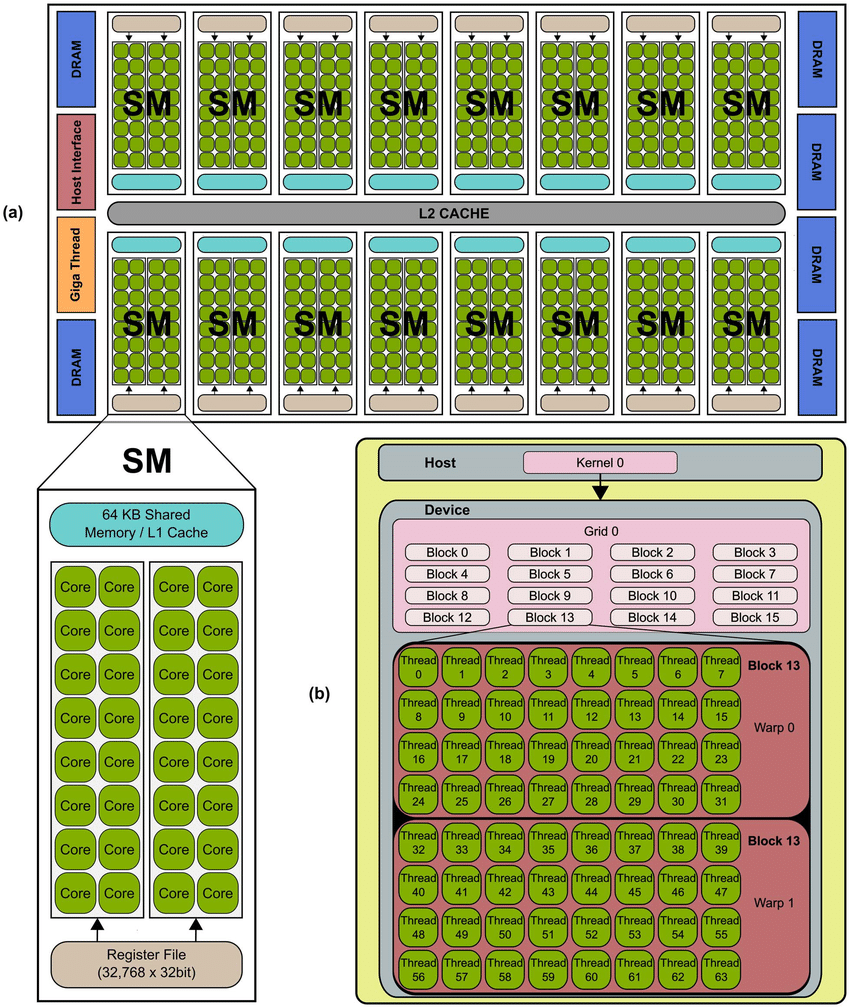
Hernandez Fernandez, Moises & Guerrero, Ginés & Cecilia, José & García, José & Inuggi, Alberto & Jbabdi, Saad & Behrens, Timothy & Sotiropoulos, Stamatios. (2015). Erratum: Accelerating fibre orientation estimation from diffusion weighted magnetic resonance imaging using GPUs (PLoS ONE (2015) 10:6 (e0130915) 10.1371/journal.pone.0130915). PLoS ONE. 10. 10.1371/journal.pone.0130915.

Levels of NVIDIA GPU Architecture (2025)

  1. Graphics Processing Cluster (GPC): Top-level cluster that contains TPCs and manages workload distribution.
  2. Texture Processing Cluster (TPC): Contains Streaming Multiprocessors (SMs) and texture units.
  3. Streaming Multiprocessor (SM): The computational engine with CUDA cores, registers, and cache.
  4. CUDA Cores: The smallest processing unit in NVIDIA GPUs.

Each layer is optimized for massive parallelism and throughput.


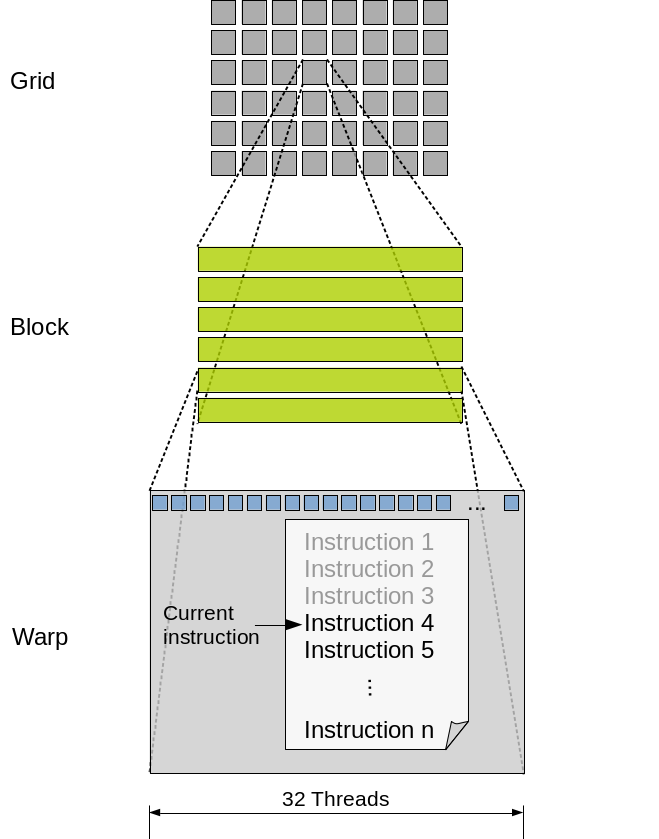
🔁 The Grid: How GPU Threads Are Organized

In CUDA, threads are organized into:

  • Threads: Single instruction executors
  • Warps: 32 threads grouped for SIMT (Single Instruction, Multiple Threads) execution
  • Blocks: Collections of warps
  • Grids: Collections of blocks
Chapuis, Guillaume & Eidenbenz, Stephan & Santhi, Nandakishore. (2015). “GPU Performance Prediction Through Parallel Discrete Event Simulation and Common Sense”. 10.4108/eai.14-12-2015.2262575.

📌 SIMT is not the same as SIMD. In SIMT, threads may diverge, allowing for more flexible execution.

This structure is why GPUs scale so well—from a GTX 1650 to an A100 or H100—by just increasing the number of SMs and CUDA cores.


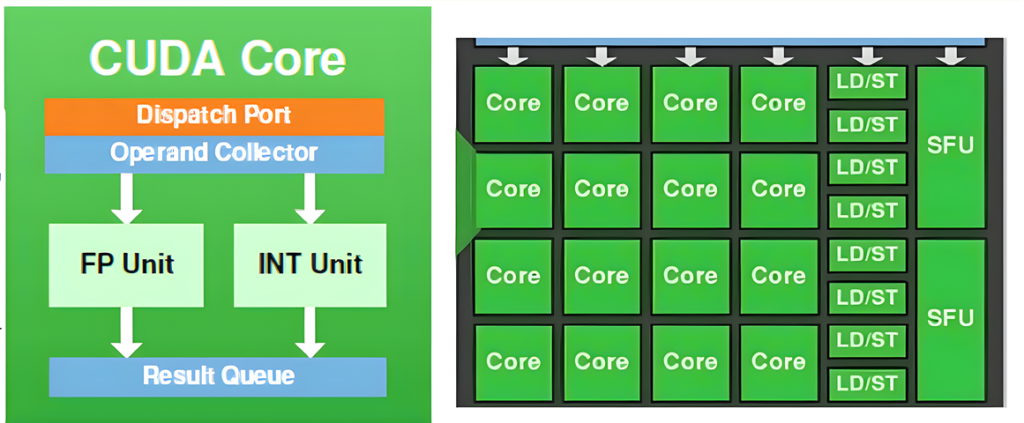
⚙️ CUDA Cores: The Heart of the NVIDIA GPU

Source: cudocompute.com

Each CUDA Core performs:

  • Integer operations via ALU
  • Floating-point operations (FP32, FP16)
  • Memory access operations via load/store units
  • Instruction decoding and execution

Example structure inside a CUDA core:

  • ALU (Arithmetic Logic Unit)
  • Register file
  • Instruction decoder
  • Control logic

These cores execute in parallel across warps under SIMT, boosting throughput for matrix-heavy tasks like image filters or neural network inference.


👨‍💻 Programming with CUDA (Hello World)

NVIDIA provides CUDA, a C/C++-like language for writing GPU code. Here’s a simple CUDA kernel to add two vectors:

cCopyEdit__global__ void vectorAdd(float *A, float *B, float *C, int N) {
    int i = threadIdx.x + blockIdx.x * blockDim.x;
    if (i < N) C[i] = A[i] + B[i];
}
  • __global__: Marks a function as a GPU kernel.
  • threadIdx, blockIdx, and blockDim: Built-in variables that locate threads in the grid.

This model maps well to the GPU’s architecture, where thousands of threads execute in parallel.


📌 Summary

  • NVIDIA GPUs are designed for parallel processing using a hierarchical architecture.
  • The architecture scales from GPC → TPC → SM → CUDA cores.
  • CUDA enables direct access to GPU hardware through a thread-block-grid model.
  • Understanding SIMT, warps, and memory layout is key to efficient GPU programming.

I blog about latest technologies including AI / ML, Audio / Video, WebRTC, Enterprise Networking , automotive and more. In the next blog, we’ll explore GPCs, TPCs, and SMs in-depth—including scheduling, caches, and warp control. Follow my blog here and on Linkedin.

🔄 Google’s Agent2Agent (A2A) Protocol: A New Era of AI Agent Interoperability


Google has introduced the Agent2Agent (A2A) protocol, a revolutionary open standard designed to enable seamless communication between AI agents. This innovation, backed by over 50 major tech partners, allows autonomous agents to collaborate across platforms, applications, and organizations—even when built using different technologies.


🌐 Why the Agent2Agent Protocol Is a Game-Changer

As AI agents become central to productivity and automation, enterprises face a major challenge: AI agents often can’t talk to each other. Without a standard protocol, they’re siloed, and their potential is limited.

Google’s A2A protocol solves this by providing a secure, scalable, and open way for agents to:

  • Exchange structured tasks and results
  • Work asynchronously across platforms
  • Handle multiple data formats including text, audio, video, and files

🧠 Core Concepts of the Agent2Agent Protocol

👤 Key Roles in Agent2Agent protocol

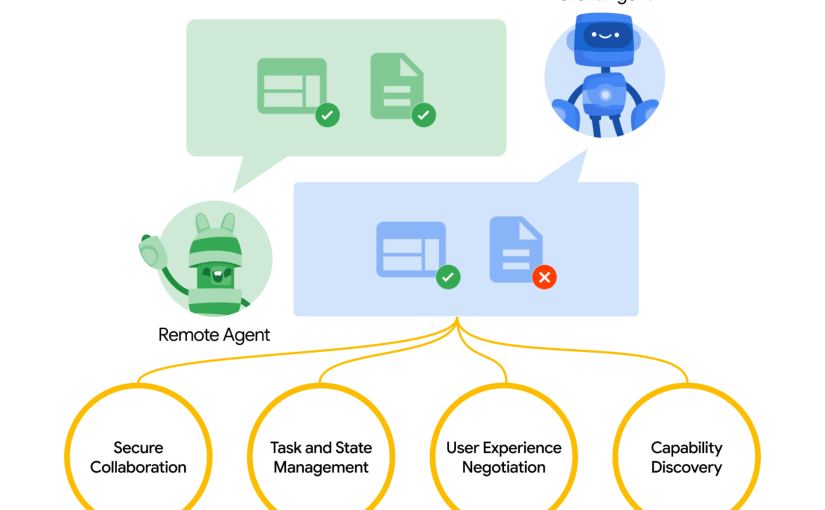
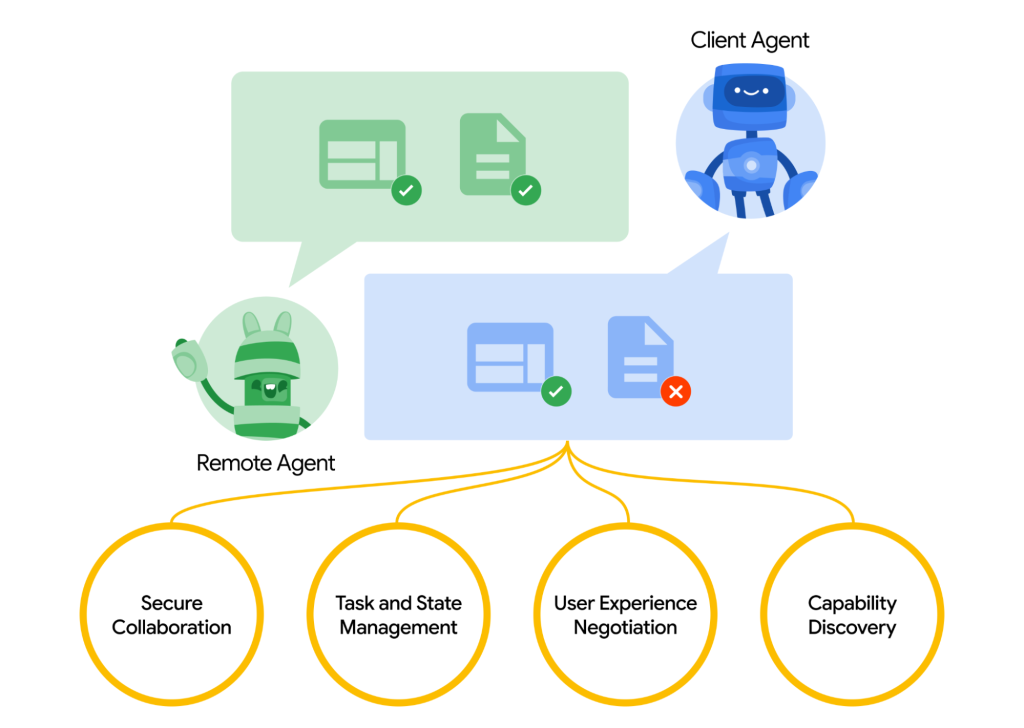
A2A defines three main participants:

  • User – A human or service initiating a request
  • Client Agent – Acts on behalf of the user
  • Remote Agent – Fulfills the task via A2A

This structure supports both human-in-the-loop and fully automated workflows.

🔌 Transport and Communication in the Agent2Agent Protocol

  • Transport: HTTP(S) + Server-Sent Events (SSE)
  • Protocol Format: JSON-RPC 2.0
  • Discovery: Agent Cards using standard JSON hosted at .well-known/agent.json


🪪 Agent Cards: Advertise Capabilities

Agent Cards describe what an agent can do, its supported modalities, and authentication requirements. Here’s an example:

{
  "name": "Google Maps Agent",
  "description": "Plan routes and generate directions",
  "url": "https://maps-agent.google.com",
  "skills": [
    {
      "id": "route-planner",
      "name": "Route planning",
      "description": "Helps plan routing between two locations",
      "tags": ["maps", "routing"]
    }
  ]
}

These Agent Cards help other agents choose the best partner to complete a task.


🚀 Sending and Completing Tasks

A2A tasks represent a unit of work between agents. Here’s how a task is created:

{
  "jsonrpc": "2.0",
  "method": "tasks/send",
  "params": {
    "id": "uuid-task-id",
    "message": {
      "role": "user",
      "parts": [{
        "type": "text",
        "text": "Book a conference room"
      }]
    }
  }
}

A response might include artifacts, such as:

{
  "status": {
    "state": "completed"
  },
  "artifacts": [{
    "parts": [{
      "type": "text",
      "text": "Room booked for 10 AM tomorrow."
    }]
  }]
}

A task can be:

  • Immediate
  • Long-running
  • Require multiple agent interactions

🔄 Multi-Turn Conversations

Agents can pause and wait for input. This allows dynamic, back-and-forth workflows. Example:

  1. User: “Request a new phone.”
  2. Agent: “Select a phone type (iPhone or Android)”
  3. User: “Android”
  4. Agent: “Ordered. Your request number is R12443.”

🧵 Streaming Support with SSE

For long tasks, agents can stream updates using tasks/sendSubscribe:

{
  "method": "tasks/sendSubscribe",
  "params": {
    "message": {
      "parts": [{ "type": "text", "text": "Write a report" }]
    }
  }
}

You’ll receive real-time updates like:

data: {
  "artifact": {
    "parts": [
      { "type": "text", "text": "Intro section complete." }
    ]
  }
}

This reduces latency and improves interactivity for complex tasks.


📡 Push Notifications for Offline Updates

Clients can set up push notification endpoints:

{
  "method": "tasks/pushNotification/set",
  "params": {
    "id": "task-id",
    "pushNotificationConfig": {
      "url": "https://example.com/callback",
      "authentication": { "schemes": ["jwt"] }
    }
  }
}

This is ideal for enterprise-grade systems needing alerts on disconnected tasks.


🎨 Multi-Modal Support

A2A supports:

  • Text
  • Audio
  • Video
  • Files (PDFs, images, etc.)
  • Structured data (JSON schema)

Example of a request with a file:

"parts": [
  { "type": "text", "text": "Summarize this document" },
  { "type": "file", "file": { "mimeType": "application/pdf", "data": "&lt;base64>" } }
]


⚖️ A2A vs Anthropic’s MCP

FeatureA2A (Google)MCP (Anthropic)
FocusAgent-to-agent interoperabilityAgent context-sharing
TransportHTTP + SSEJSON over HTTP
Multi-modalityYesText only (mostly)
Push NotificationsYesNo
Long TasksBuilt-in state managementNot native
Agent DiscoveryAgent CardsManual or non-standard
Open SourceYesNot fully

While MCP enriches a single agent’s decision-making, A2A enables real collaboration between independent agents.


🛠 Real-World Applications

🔧 IT Automation

  • A helpdesk agent detects a ticket
  • Another agent gathers logs from a system
  • A third agent takes corrective action

👔 HR and Recruitment

  • The hiring agent sources candidates
  • The scheduler agent books interviews
  • The compliance agent runs background checks

A2A glues these together into one seamless workflow.


❌ Error Handling Made Simple

A2A uses JSON-RPC standard errors like:

  • -32700: JSON parse error
  • -32601: Method not found
  • -32001: Task not found

Agents return meaningful messages and even suggest retries or alternate modalities.


🔍 Conclusion: Why A2A is the Future

The A2A protocol sets a new standard for AI agent collaboration. With support for streaming, structured output, rich media, and open discovery—it’s built for the real world of enterprise AI.

If you’re building multi-agent ecosystems, A2A is the protocol you’ve been waiting for.


📚 Further Reading


If you liked this blog, you will also like my blog on Timeline from Transformers to LLM and Agentic AI and the most popular ML basics – Supervised Machine Learning for beginners

Timeline from Transformers to LLMs and Agentic AI

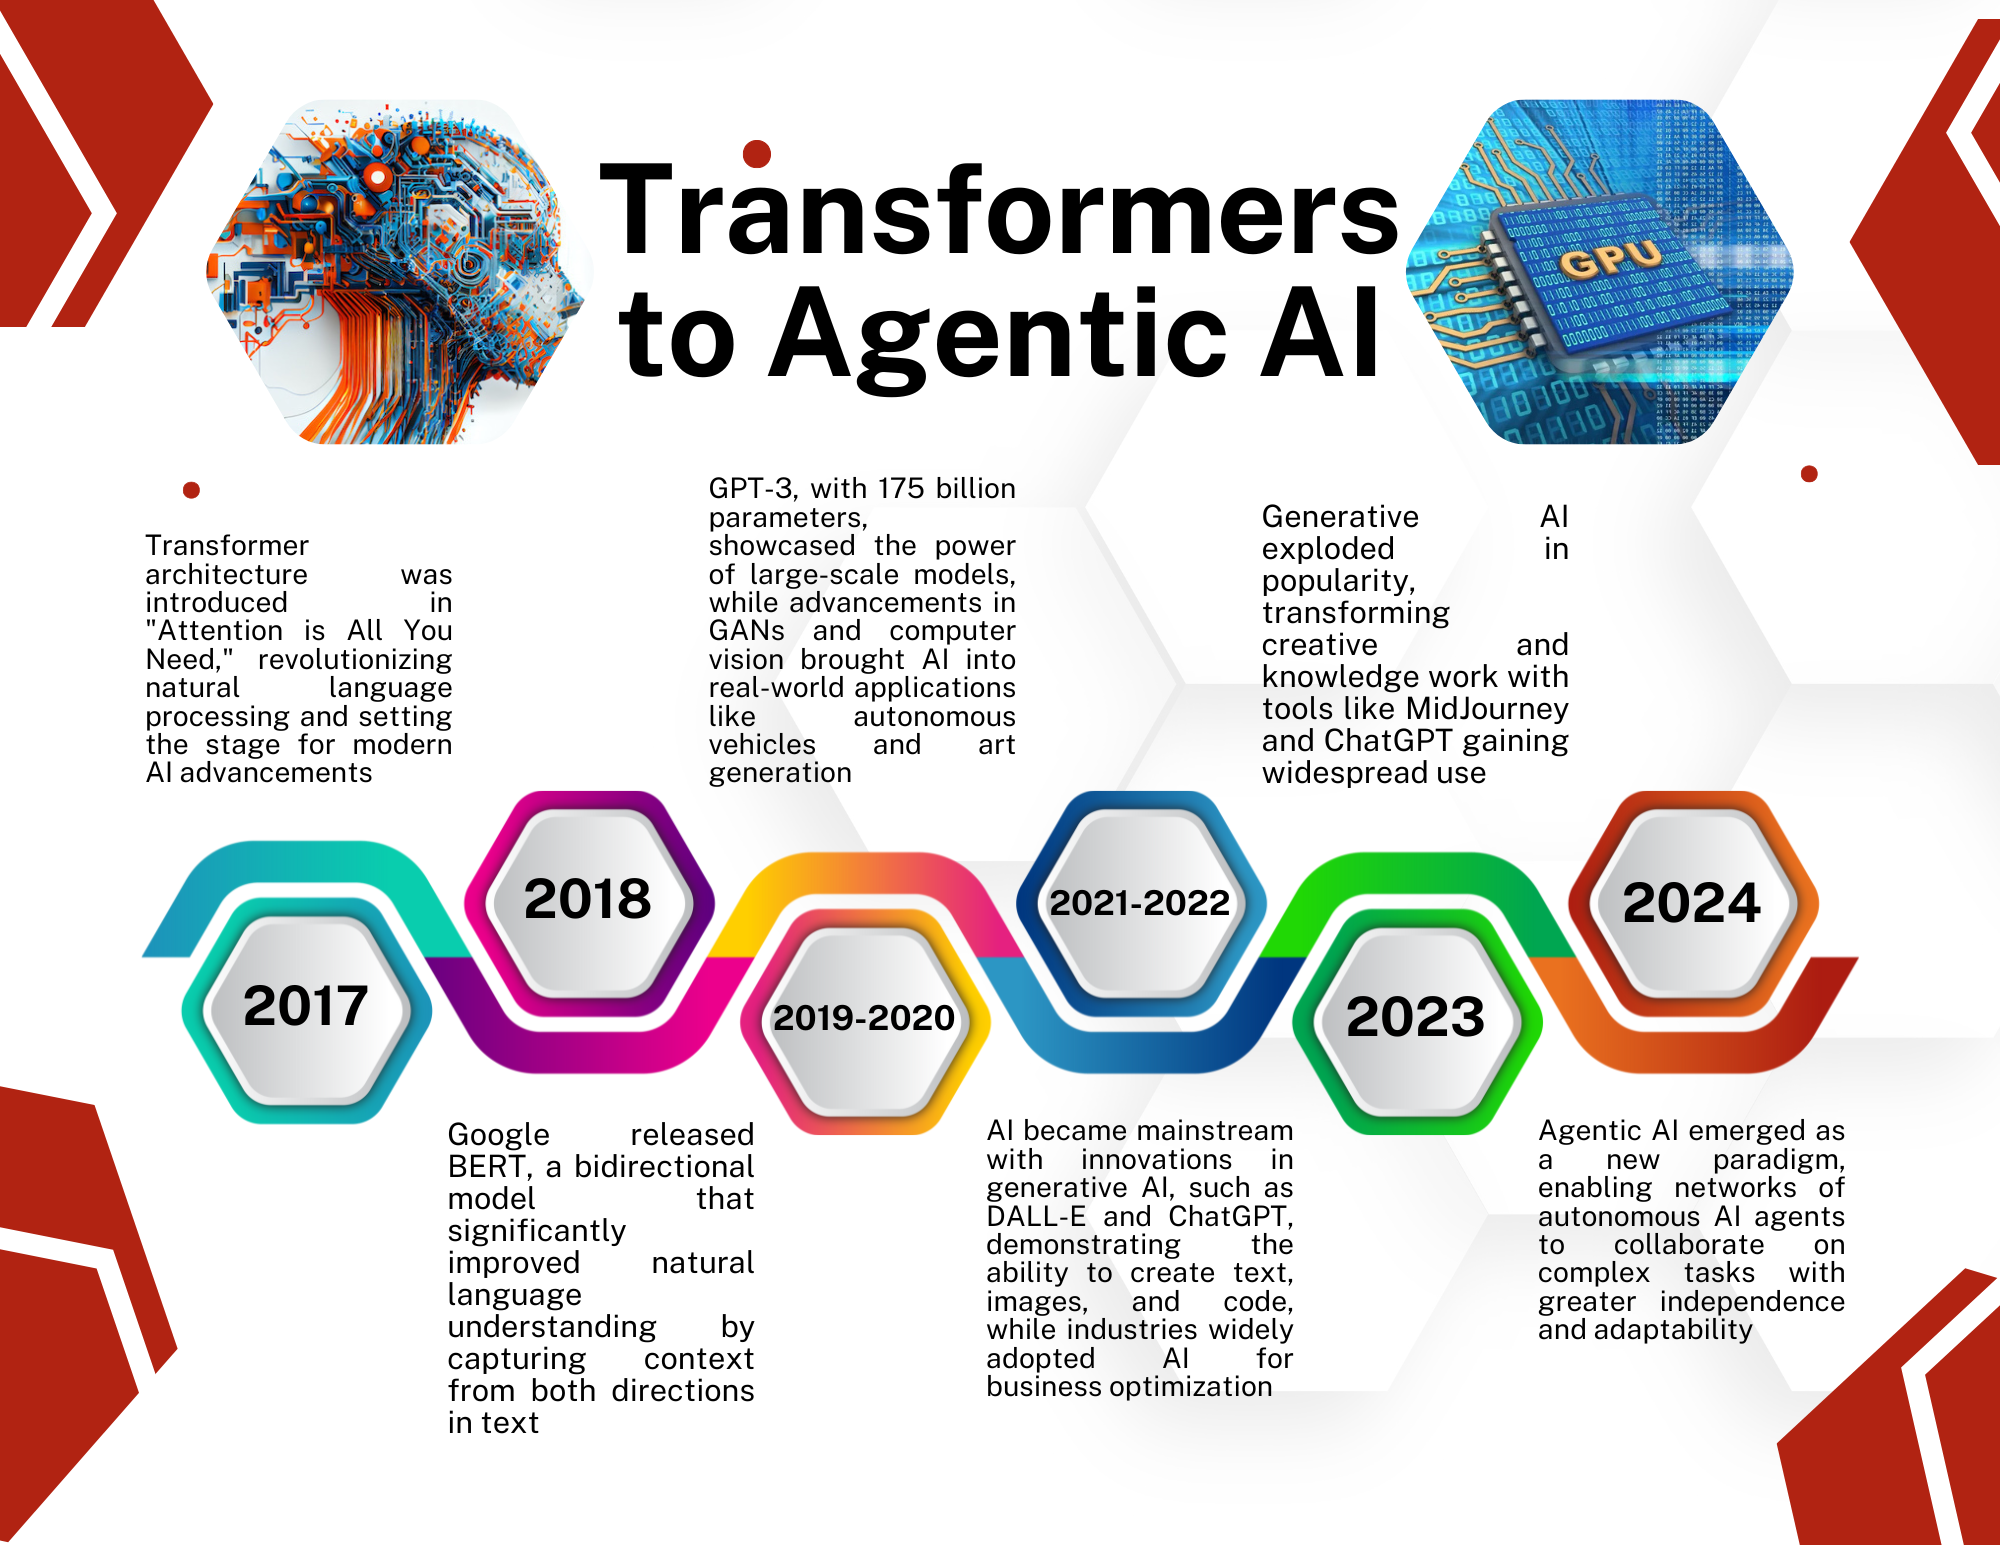
Since the groundbreaking 2017 paper “Attention is All You Need” introduced the Transformer architecture, the field of artificial intelligence has undergone a rapid and transformative evolution. This blog post will explore the chronology of important events that have shaped the AI landscape, leading up to the current era of Large Language Models (LLMs) and agentic AI. Let us visit the timeline from Transformers to LLM and Agentic AI

2017: The Transformer Revolution

The journey begins with the publication of “Attention is All You Need” by Google scientists in 2017. This paper introduced the Transformer architecture, which relied solely on attention mechanisms, dispensing with recurrence and convolutions entirely. The new model demonstrated superior translation quality and efficiency in machine translation tasks, setting the stage for a paradigm shift in natural language processing.

2018: BERT and the Rise of Bidirectional Models

Building on the success of Transformers, 2018 saw the introduction of BERT (Bidirectional Encoder Representations from Transformers) by Google researchers. BERT’s innovation lay in its bidirectional nature, allowing it to capture context from both directions in text data. This breakthrough significantly improved performance across various language tasks, from question-answering to sentiment analysis.

2019-2020: The GPT Era Begins

OpenAI’s release of GPT-3 (Generative Pre-trained Transformer 3) in 2020 marked a significant milestone in the development of large language models. With 175 billion parameters, GPT-3 demonstrated unprecedented capabilities in natural language understanding and generation, capturing the imagination of researchers and the public alike.

2021-2022: AI Goes Mainstream

During this period, AI technologies began to permeate various industries and applications:

  • AI in Healthcare: The healthcare and pharmaceutical sectors emerged as early adopters of AI, leveraging it for tasks such as appointment scheduling, patient care, and personalized treatment.
  • Self-Driving Vehicles: AI agents moved beyond software into the physical world, making real-time, high-stakes decisions in autonomous vehicles.
  • Code Generation: AI systems like GitHub Copilot began assisting developers in writing code, hinting at the potential for AI to transform software development.
Timeline from Transformers to LLM and Agentic AI

2023: The Year of Generative AI

2023 saw an explosion in generative AI applications, with tools like DALL-E, Midjourney, and ChatGPT capturing public attention. These models demonstrated the ability to generate high-quality text, images, and even code, sparking discussions about the future of creative work and knowledge work.

2024: The Dawn of Agentic AI

As we moved into 2024, the concept of Agentic AI began to take shape. This new paradigm represented a shift from isolated AI tasks to specialized, interconnected agents capable of more autonomous operation. Key developments included:

  • Multi-Agent Systems: AI agents began working collaboratively to solve complex problems, simulating human teamwork in digital environments.
  • Small Language Models (SLMs): The adoption of SLMs alongside LLMs offered new possibilities for efficient, task-specific AI solutions.
  • AI Orchestration: Frameworks for coordinating multiple AI agents emerged, allowing for more complex problem-solving approaches.

2025: The Year of Agentic AI

As we stand in 2025, Agentic AI has become the new frontier in artificial intelligence. This evolution is characterized by several key trends:

  1. Autonomous Decision-Making: AI agents now operate with greater independence, capable of long-term planning and adapting to changing conditions without constant human oversight.
  2. AI Engineers: Systems like Devin AI are now capable of debugging and writing code on their own, pushing the boundaries of what AI can achieve in software development.
  3. Industry Transformation: Agentic AI is revolutionizing various sectors, with the potential to take over entire departments in organizations. For example:
    • In healthcare, AI agents manage tasks from appointment scheduling to personalized treatment plans.
    • In customer service, AI-driven virtual assistants provide increasingly sophisticated and personalized support.
  4. Multi-Agent Collaboration: OpenAI’s introduction of “Swarm,” an experimental framework for coordinating networks of AI agents, has opened new possibilities for complex problem-solving.
  5. Enhanced Personalization: Advanced learning algorithms enable AI agents to tailor services and products to individual needs, creating highly personalized experiences across industries.
  6. Scalable Automation: AI agents are driving automation at an unprecedented scale, from small businesses to large enterprises, significantly reducing costs and operational inefficiencies.
  7. Continuous Learning and Adaptation: Agentic AI systems demonstrate the ability to learn autonomously and adapt to dynamic environments, enabling faster growth and efficiency across sectors.

As we look to the future, the potential of Agentic AI seems boundless. From enhancing decision-making processes to revolutionizing entire industries, these intelligent agents are poised to transform the way we work, create, and solve problems. However, this rapid advancement also brings new challenges in ethics, privacy, and workforce adaptation that society must address.

We saw and have actually lived through this timeline from Transformers to LLM and Agentic AI. The journey has been remarkably swift, showcasing the exponential pace of innovation in artificial intelligence. As we explore the vast potential of Agentic AI, the broader quest for Artificial General Intelligence (AGI) remains a captivating goal. AGI aims to create intelligent systems capable of performing any intellectual task that humans can and represents the ultimate frontier in artificial intelligence. Another interesting article on this topic can be found here. For a deeper dive into the most basic concepts on AI and Machine Learning please visit my other blog pages.

A Deep Dive into PyTorch’s GPU Memory Management

Here is an error I got when using an image generation deep learning model. It is a common error Engineers get when using PyTorch on GPU. To solve this error, a deep dive into PyTorch’s GPU Memory management is needed. So fasten your seat belts 🙂

torch.OutOfMemoryError: CUDA out of memory. Tried to allocate 58.00 MiB. GPU 0 has a total capacity of 3.71 GiB of which 57.00 MiB is free. Including non-PyTorch memory, this process has 3.64 GiB memory in use. Of the allocated memory 3.51 GiB is allocated by PyTorch, and 74.06 MiB is reserved by PyTorch but unallocated. If reserved but unallocated memory is large try setting PYTORCH_CUDA_ALLOC_CONF=expandable_segments:True to avoid fragmentation.  See documentation for Memory Management  (https://pytorch.org/docs/stable/notes/cuda.html#environment-variables)

This error message provides valuable insights:

  • Memory Exhaustion: The GPU’s available memory (3.71 GiB) has been depleted.
  • Allocation Attempt: PyTorch attempted to allocate 20.00 MiB, but there wasn’t enough free space.
  • Memory Usage: 3.68 GiB is in use, with 3.61 GiB allocated by PyTorch and 5.27 MiB reserved but unallocated.
  • Fragmentation Hint: The message suggests that memory fragmentation might be contributing to the issue, and setting PYTORCH_CUDA_ALLOC_CONF=expandable_segments:True might help.

PyTorch’s Memory Management Strategies

PyTorch employs a sophisticated memory management system to optimize GPU resource utilization. Here’s a detailed breakdown:

  • Caching Allocator: PyTorch uses a caching allocator to reduce the overhead of frequent memory allocations and deallocations. This improves performance but can also contribute to memory fragmentation if not managed effectively.
  • Memory Pooling: PyTorch pools memory into larger blocks to reduce fragmentation and improve allocation efficiency.
  • Automatic Deallocation: PyTorch automatically deallocates memory for tensors that are no longer needed, reducing the risk of memory leaks.
  • torch.cuda.empty_cache(): This function manually clears the cached memory, potentially freeing up unused resources.
  • PYTORCH_CUDA_ALLOC_CONF: This environment variable allows you to fine-tune memory allocation behavior. Experimenting with different configurations can help address fragmentation issues.

Profiling Tools for Deep Insights

To gain a granular understanding of memory usage and identify bottlenecks, profiling tools are indispensable:

NVIDIA System Management Interface (NVIDIA-smi):

  • Real-time monitoring of GPU utilization, temperature, and memory usage.
  • Provides detailed information about processes and applications consuming GPU resources.
  • Example usage in Bash: nvidia-smi
    watch -n0.1 nvidia-smi

    PyTorch Memory Profiler

    • Records memory allocations and deallocations during program execution.
    • Visualizes memory usage patterns over time.
     enable memory history, which will
    # add tracebacks and event history to snapshots
    torch.cuda.memory._record_memory_history()
    
    run_your_code()
    torch.cuda.memory._dump_snapshot("my_snapshot.pickle")

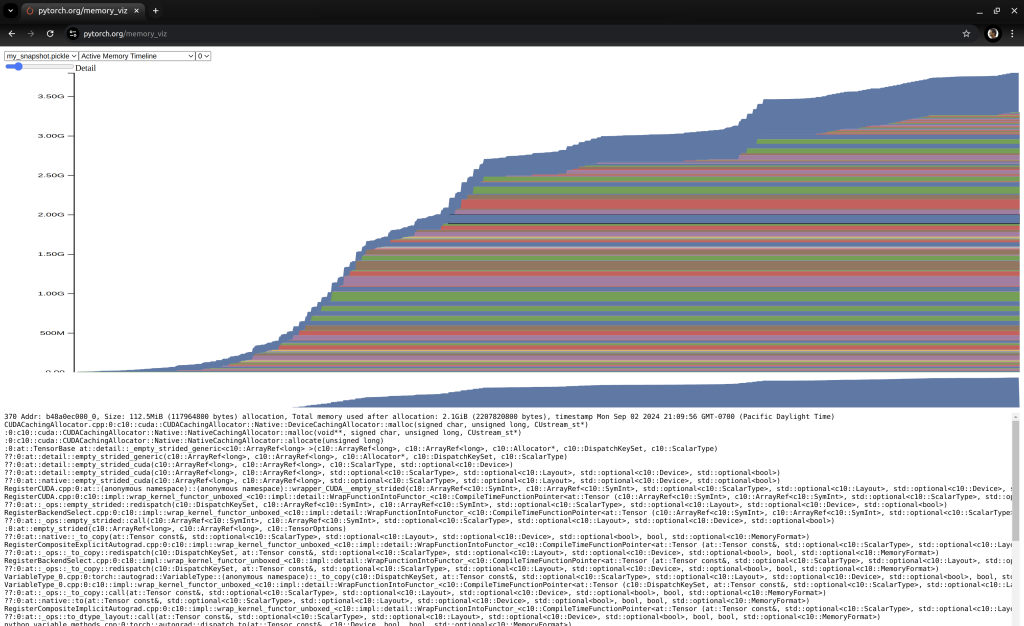
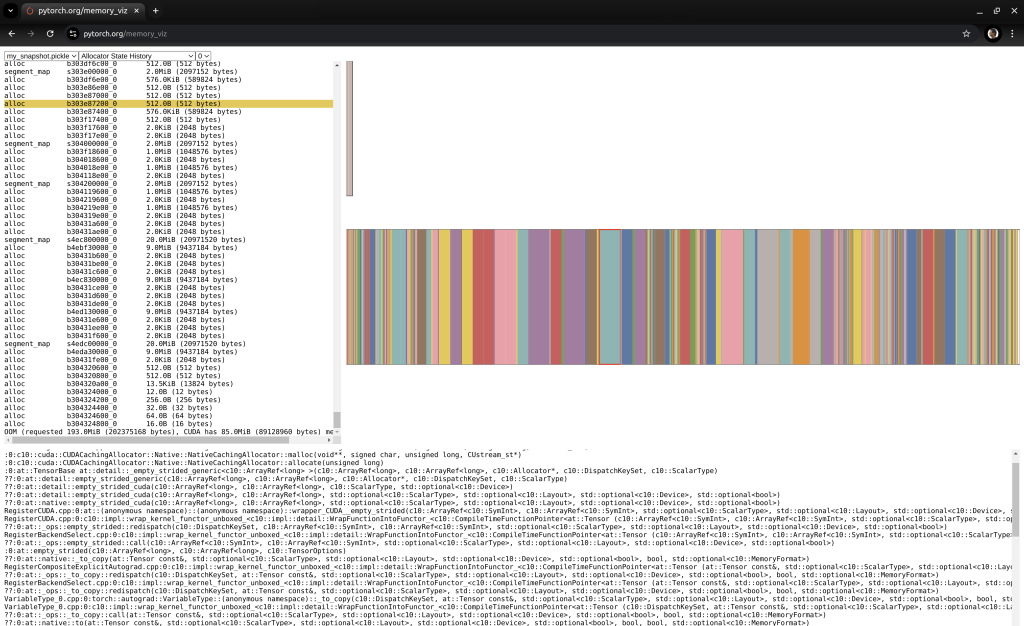
    Open pytorch.org/memory_viz and drag/drop the pickled snapshot file into the visualizer. The visualizer is a javascript application that runs locally on your computer. It does not upload any snapshot data.

    Active Memory Timeline in PyTorch Memory visualizer

    Allocator State History in PyTorch Memory visualizer

    • Integrates seamlessly with PyTorch models and training scripts.
    • Example usage:
    import torch.profiler as profiler
    with profiler.profile() as prof:
    # Your PyTorch code here
    # ...

    # Print the profiling results print(prof.key_metrics())

    Nsight Systems:

    • A powerful profiling tool that provides detailed insights into GPU utilization, memory usage, and performance bottlenecks.
    • Offers visualizations for performance analysis.
    • Example usage in Bash
    nsight-systems --profile-gpu --launch-command="python your_script.py"

    Debugging and Optimization Strategies

    1. Reduce Model Size: If possible, use a smaller or optimized version of the Stable Diffusion model to reduce memory requirements.
    2. Adjust Batch Size: Experiment with different batch sizes to find the optimal balance between performance and memory usage.
    3. Optimize Data Loading: Ensure your data loading pipeline is efficient and avoids unnecessary memory copies.
    4. Monitor Memory Usage: Use profiling tools to track memory consumption and identify areas for optimization.
    5. Consider Memory-Efficient Techniques: Explore techniques like gradient checkpointing or quantization to reduce memory usage.
    6. Leverage Cloud-Based GPUs: If your local hardware is constrained, consider using cloud-based GPU instances with larger memory capacities.

    Additional Considerations:

    • GPU Driver Updates: Ensure you have the latest GPU drivers installed to avoid performance issues or memory leaks.
    • Operating System Configuration: Check your operating system’s memory management settings to see if they can be optimized for better GPU performance.
    • TensorFlow vs. PyTorch: If you’re using TensorFlow, explore its memory management features and best practices.

    Advanced Memory Optimization Techniques

    For more advanced scenarios, consider the following techniques:

    • Memory Pooling: Manually create memory pools to allocate and reuse memory blocks efficiently. This can be helpful for specific use cases where memory allocation is frequent.
    • Custom Memory Allocators: If you have deep knowledge of CUDA and memory management, you can create custom memory allocators to address specific memory usage patterns.
    • Profiling and Benchmarking: Use profiling tools to identify performance bottlenecks and benchmark different memory optimization strategies to measure their effectiveness.

    Beyond the Code: A Deeper Dive into Memory Management

    While we’ve covered the essential aspects of PyTorch’s memory management, it’s worth exploring the underlying mechanisms in more detail.

    • CUDA Memory Allocator: CUDA, the underlying framework for NVIDIA GPUs, provides its own memory allocator. PyTorch interacts with this allocator to allocate and manage memory on the device.
    • Memory Fragmentation: When memory is allocated and deallocated frequently, it can lead to fragmentation, where small, unused memory blocks are scattered throughout the memory space. This can make it difficult for PyTorch to allocate larger contiguous blocks of memory.
    • Memory Pooling: PyTorch’s memory pooling strategy involves creating larger memory pools and allocating memory from these pools. This can help reduce fragmentation and improve memory allocation efficiency.
    • Automatic Deallocation: PyTorch uses reference counting to track memory usage and automatically deallocates memory for tensors that are no longer needed. However, it’s important to be aware of potential memory leaks if tensors are not properly managed.
    • Profiling Tools: Profiling tools like Nsight Systems can provide detailed insights into memory usage patterns, including memory allocations, deallocations, and access patterns. This information can be invaluable for identifying memory-related bottlenecks and optimizing your code.

    Conclusion

    Overcoming the “CUDA out of memory” error requires a deep understanding of PyTorch’s memory management strategies and the ability to leverage profiling tools effectively. By following the techniques outlined in this blog post, you can optimize your PyTorch applications for efficient GPU memory usage and unlock the full potential of your NVIDIA GPU